.jpg?width=300&name=Blog%20Link%20Preview%20Image%20(24).jpg)
Network analysis is a research methodology used to study complex systems by examining the relationships, interactions, or connections between various elements within the system.
It is widely used in both computer science and social sciences. In network analysis, the elements (often referred to as "nodes") and their relationships (often referred to as "edges" or "links") are represented using visual structures we refer to as "network graphs".
Network analysis is most useful when trying to break down complexity better to understand a topic or issue, such as:
- Conflict dynamics (e.g., Who are the conflict actors and where do they disagree? What alliances exist and why?)
- Political Economy Analysis (e.g., Who holds influence or power over what issues, where, and what is the source of said influence/power?)
- Disinformation propaganda (e.g., What content is originating from what source and being shared where to scale distribution to what audiences?)
- Illicit monetary flows (e.g., Where are the funds coming from, where are they processed through on their way to where/whom?)
- Complex ownership structures for Anti-Money Laundering/banking Know-Your-Customer (KYC) checks (e.g., Who are the beneficial owners of this corporate entity? What other ventures are they participating in? Are they connected to known nefarious or blocked organizations?)
- And so much more…
Understanding Network Analysis
Network analysis can look overwhelming at first, but it is easy to grasp once you get a hold of its primary building blocks: namely, nodes and edges and basic analytical concepts such as centrality, clustering, degrees, and path length.
- Nodes are the individual elements or entities within a network, such as people, organizations, or places, and comprise the analysis's primary unit (often shown as bubbles or icons on the group).
- Edges are the relationships or connections between the nodes, which can be directed (e.g., an organization funding a project), undirected, or bidirectional (e.g., a mutual partnership).
- The degree is the number of edges connected to a node, which can be used to measure its importance within the network. We often size nodes differently on screen as a function of degree, so it is easier to spot the most important (or most connected) ones.
- Centrality is a measure to identify the most influential nodes within a network. You can mentally picture one node with multiple spokes out to various other nodes. That node will have high centrality and often appear in the middle of a cluster.
- The clustering coefficient measures the tendency of nodes to form tightly-knit groups or clusters within the network. This is most useful when grouping different actors or entities together based on shared connections or patterns.
- Modularity measures a given network's division into distinct groups or communities, with dense connections within group islands but sparse connections between said islands.
- Lastly, path length represents the number of edges in the shortest path between two nodes, which can help to understand the efficiency of information or monetary flow within the network.
Preparing the Data for a Network Analysis
Now that we understand the basic concepts, we need to think about what is required in data terms to run network analysis.
The critical thing to note is that you should be working from unique lists of entities. It's vital to ensure that you avoid duplication in your data by running different parts of your workflow in different ways.
The keyword here is unify. If you are currently operating in two dimensions (think Excel with rows and columns but virtually no links beyond that), some preliminary work will be necessary to ensure your baseline is clean and network-ready.
Working from relational databases like AKTEK iO avoids this problem altogether by ensuring that your team works off the same (connected) building blocks.
Assuming you have unique lists of entities ready, the next step is for you to determine how these lists or databases are or should be connected.
It can help to think in parent/child terms. My list of companies will be a parent to my list of employees, with individual employees being linked to one or many companies.
My list of disinformation propaganda URLs or social media posts will be children to root domains or authors where one source can produce multiple URLs.
These are the linkages in your data, some might be inherent and straightforward, and others might be more complex and require conscious architecture.
Once we have unique entities and linkages between them, the last step is to qualify those links qualitatively and quantitatively.
How will we determine the directionality of linkages? How will we evaluate the strength of a link between two nodes? How we will qualify a connection and/or weigh it in comparison to others?
Here you might think about the traffic or money that flowed from one source to a target as a way to quantitatively evaluate or visualize a connection. We might want to devise a qualitative typology for codifying connections.
Under a conflict analysis lens, you might picture "active conflict" links that are subcategorized by resources, territory, ideology, and more.
Equipped with your unique entities, actual linkage data, and metadata on said linkages, you are now ready to perform network analysis.
Steps to Perform a Network Analysis on AKTEK iO
Performing Network Analysis is much easier when done with the help of appropriate tools. Software like AKTEK iO can help you prepare your data and quickly generate network graphs for exploration and collaborative investigation.
Below is an example with anonymized information on disaster response, activities (including people affected, funding values, etc.), and implementing partners working across multiple countries affected by hurricanes in the Caribbean, helping coordination agencies understand who does what, where, and how can the humanitarian response be better organized for maximum impact.
Step 1: Data Setup
Mark reference fields in Data Structure that you want to use for Network Analysis, indicating whether you want analysts to be able to describe such links, quantify them with a weight, and/or assign directionality.
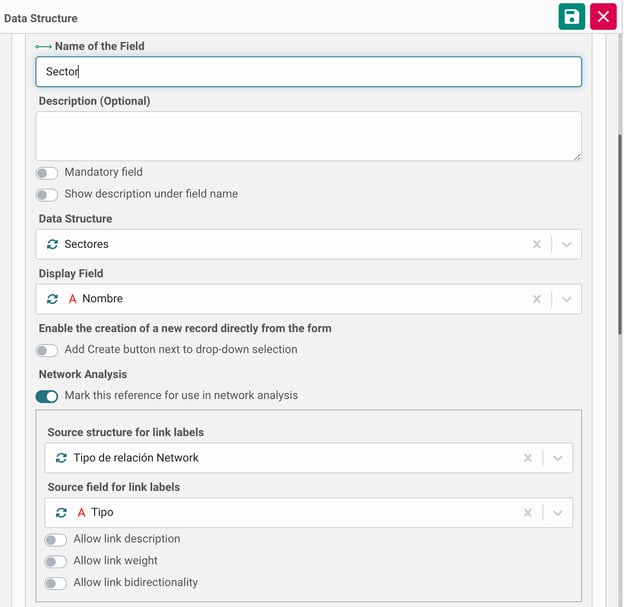
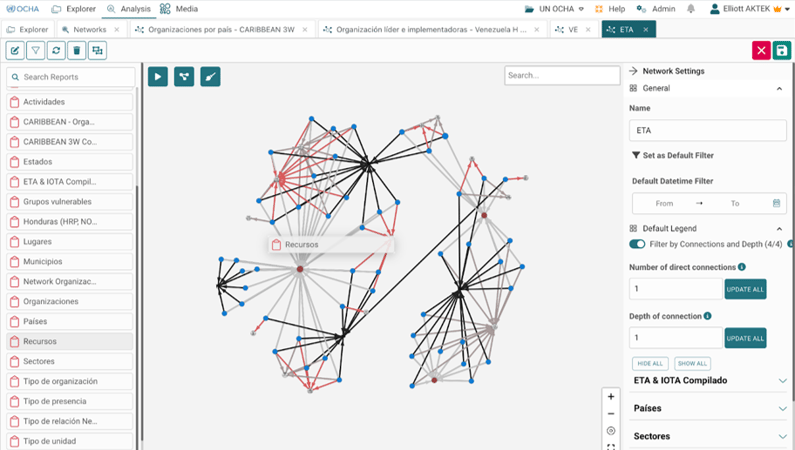
Step 2: Network Creation
Create a new network under Analysis / Network, give it a name, and simply drag and drop the data tables you want to graph onto the canvas. Connections will automatically show on the screen, and options for configuration will appear.
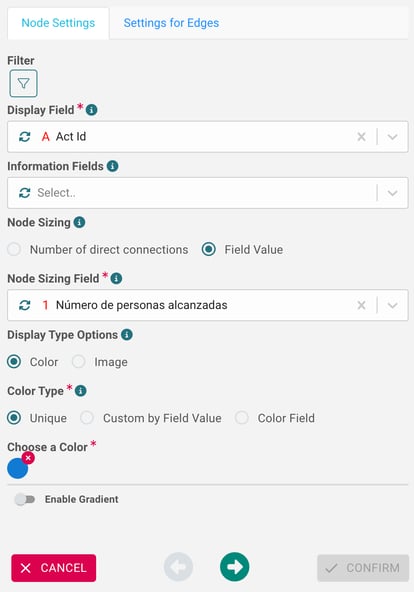
Step 3: Network Configuration
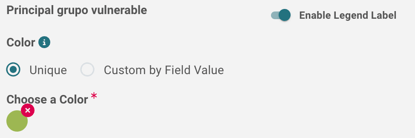
Configure how the data coming from this source should appear on the screen, indicating which labels to use and visualization options (e.g., color-coded bubbles or images, generic or specific based on field values, etc.).
You may also choose which information fields should appear upon click and how each node should be sized (for example, based on the number of people affected or the number of visits).
Once nodes are configured, you will be given the option to configure any linkage connected to this node group, giving it a color, whether unique for the link or subdivided by another categorization typology.
Step 4: Visualization Adjustments
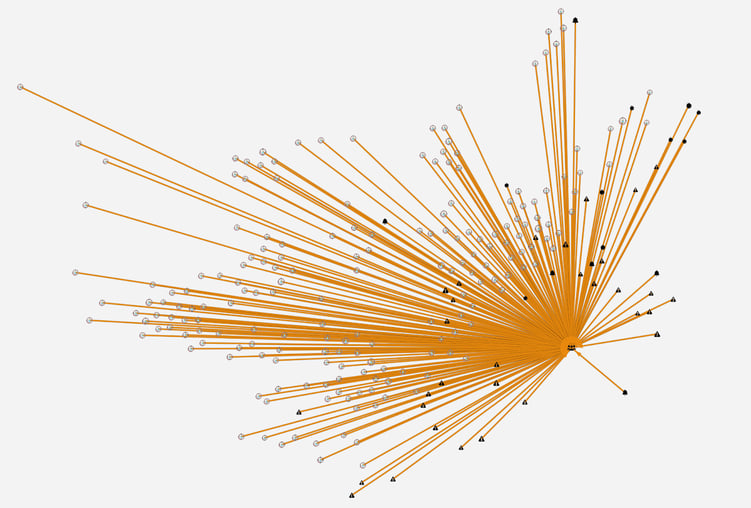
For maximum impact and analytical value, you can edit variables that affect layout algorithms and/or visualization configuration (node/edge size, spacing, etc.) to surface key insights (e.g., highlighting clusters and/or bridges between clusters, as shown below).
Once satisfied, the view can be saved for future reference, always updated with new, incoming data based on your user's credentials.
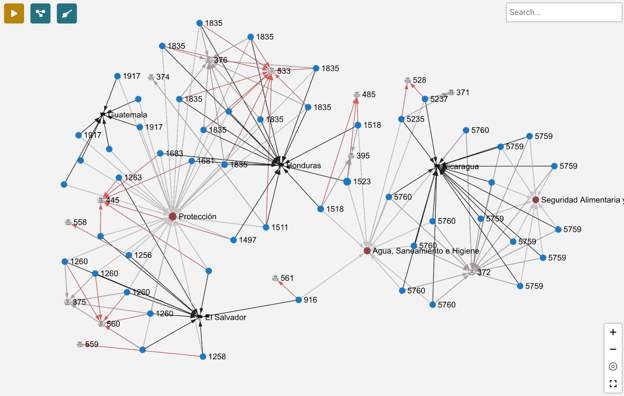
E.g., moving from this picture to this…
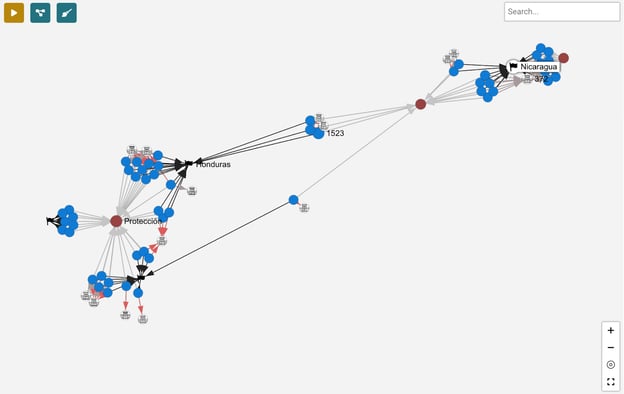
Here some key organizations (noted by the building icon) are shown to operate across key territories on a variety of issues and represent an opportunity for the humanitarian response coordination agency to leverage them to influence the whole system more efficiently using the limited resources they have.
Step 5: Deep dives
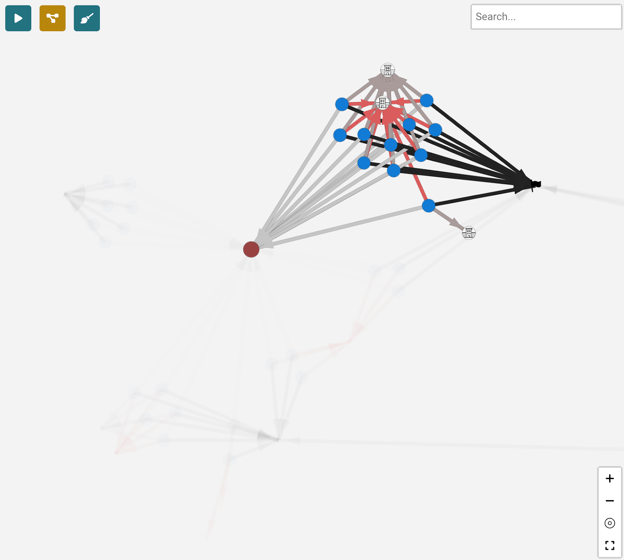
You can click on any node of interest to see more information and isolate it from the whole.
Using the subgraph tool, you can expand to visualize 1st, 2nd, and 3rd connections from that starting point and better understand the system around this node (for example, one supplier of interest and their 2nd, 3rd-degree connections to different nodes in the system).
Search and filter can be used to explore the graph in useful ways, allowing you to better understand and communicate actionable insights from your data.
Conclusion:
Network analysis is crucial for understanding complex systems, helping your team examine the relationships, interactions, and connections between various elements within these systems, whether they are reflections of a physical or virtual environment.
AKTEK iO is a platform that simplifies network analysis, making it more accessible to a wider audience. By offering user-friendly tools and features, AKTEK iO streamlines the process of data collection, preparation, and visualization of networks.
It provides an intuitive interface that allows users to easily create, manipulate, and explore network graphs without requiring technical expertise or programming skills.
By making network analysis more accessible, AKTEK iO empowers individuals and organizations to better understand complex systems and make informed decisions based on data-driven insights.