Besides showing you the improvements we've done this month, we want to end this year by compiling all the new features and functionalities we added to AKTEK iO this year. You can also check the specific updates that we had in the months of September, October, and November.
DECEMBER UPDATES
Third-Party Data integration
New capability on AKTEK iO
If your data is already stored on external databases, you can now import it to AKTEK iO, and keep synchronizations for any changes done on the third-party database.
Contact your account manager to learn more about this feature and to get a quote.
Data Structure
Multi sub-form
Add any entries to the same sub-form using the Multi sub-form field type.
Choose the data structure, the headers or columns to be filled, and the display field.
Business Process
Complete uplift of the User interface and User experience
The business process section is revamped for an easier user interface annotated by colors.
Also, the configuration of the tasks and steps is more user-friendly.
Engage your team and build your workflow in a few minutes!
New Helpdesk
With this new year, we bring you a new helpdesk! It’s easier to navigate and has up-to-date information and examples. You can still use the same link and the same password as before.
Dashboard
New visualizations
A mixed chart is added to the dashboard components. Configure your mixed chart by adding layers (bar, line, area, or scatter). You can also choose to stack the bars on top of each other.
Charts appearance options
New options added to appearance:
Choose the orientation to see the bars vertically or horizontally
Possibility to sort the data on the chart alphabetically (values on the x-axis will be sorted alphabetically) or by value (data will be sorted by the value of the chosen measure)
Possibility to sort ascending or descending
Possibility to put a limit on the number of data to display. For example, if the user chooses to sort by value, descending, and the limit is 4 ⇒ the top 4 values will be displayed

Ready to get started on AKTEK iO?
Click here to learn more
2021 UPDATES
NETWORK
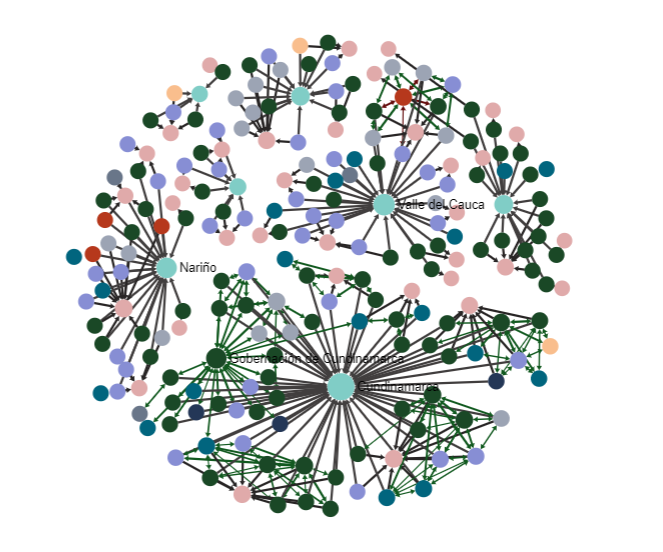
Using AKTEK iO for political economy analysis, stakeholder mapping, and network analysis allows better management of your stakeholders, critical issues, and relational data.
Go to AKTEK iO: Network > Create or Navigate existing Networks
The Network module allows users to pull data from their created reports and visualize the direct and indirect links between different values inside your database. The display of network nodes can highlight non-trivial data discrepancies that may otherwise be overlooked.
Connect your data!
Network visualizations can be used for anything relational. From roads and supply chains to electoral analysis, any two or more items that share a relationship can form a network and help you uncover critical insights.

Building a network is a process that starts from Data Structure and finishes on the network graph visualization.
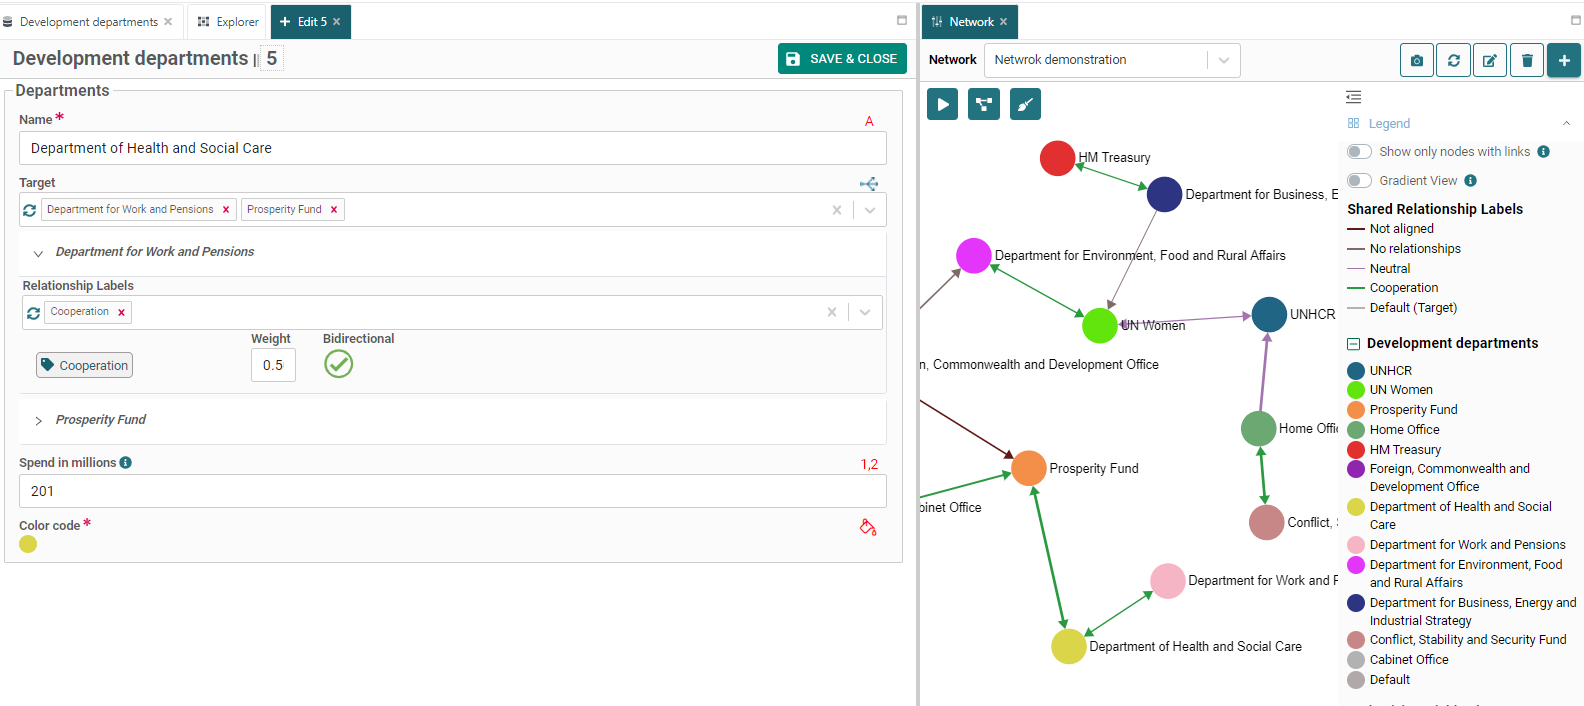
Go to AKTEK iO: Network > Interact with any Network by toggling on/off the different legend, graph, and layout options.
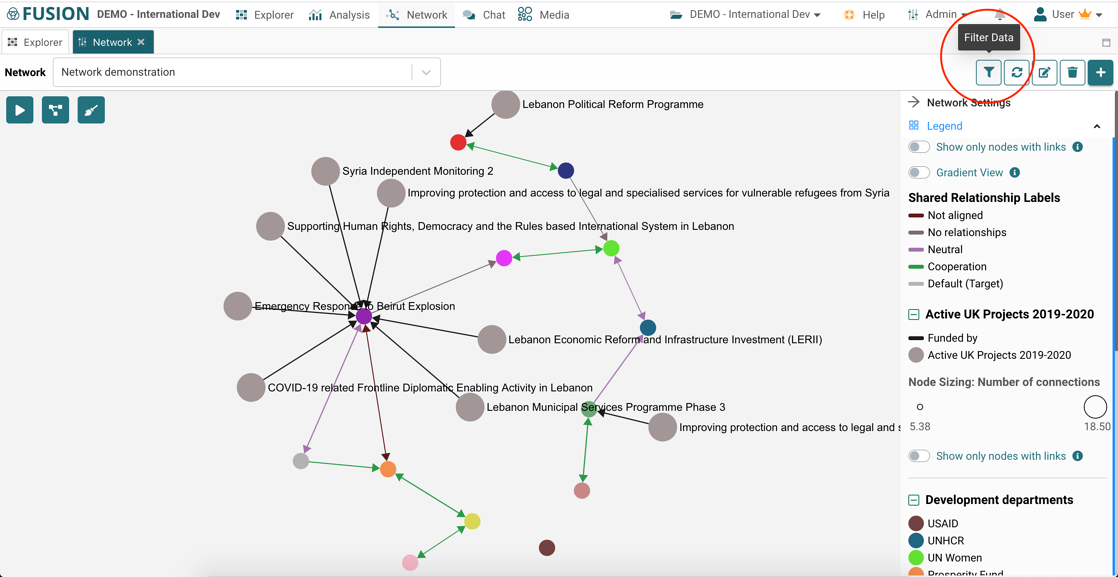
Filter data in NETWORK!
You can now use AKTEK iO's smart filter functionality to filter data inside the reports added to your Networks. This will filter the data displayed in your Network graph.
Gradient view in Network
In Network, the gradient functionality will allow you to have a secondary view of your nodes based on a different color code tied to a quantitative variable of your choice. With it, you can see data values for the minimum and maximum boundaries of your dataset once your gradient view is toggled on, as shown below:

Go to: AKTEK iO > Click on Network > Select one > Activate gradient view.
Ready to get started on AKTEK iO?
Click here to learn more
MEDIA
New data visualizations in MEDIA
In MEDIA dashboards, you can now find new types of visualizations available for your widgets. Go to MEDIA > dashboards and add or edit a widget to do so. Once you select your data module, you will be able to choose different types of visualizations, including new visualizations for the mentions and language analysis modules.

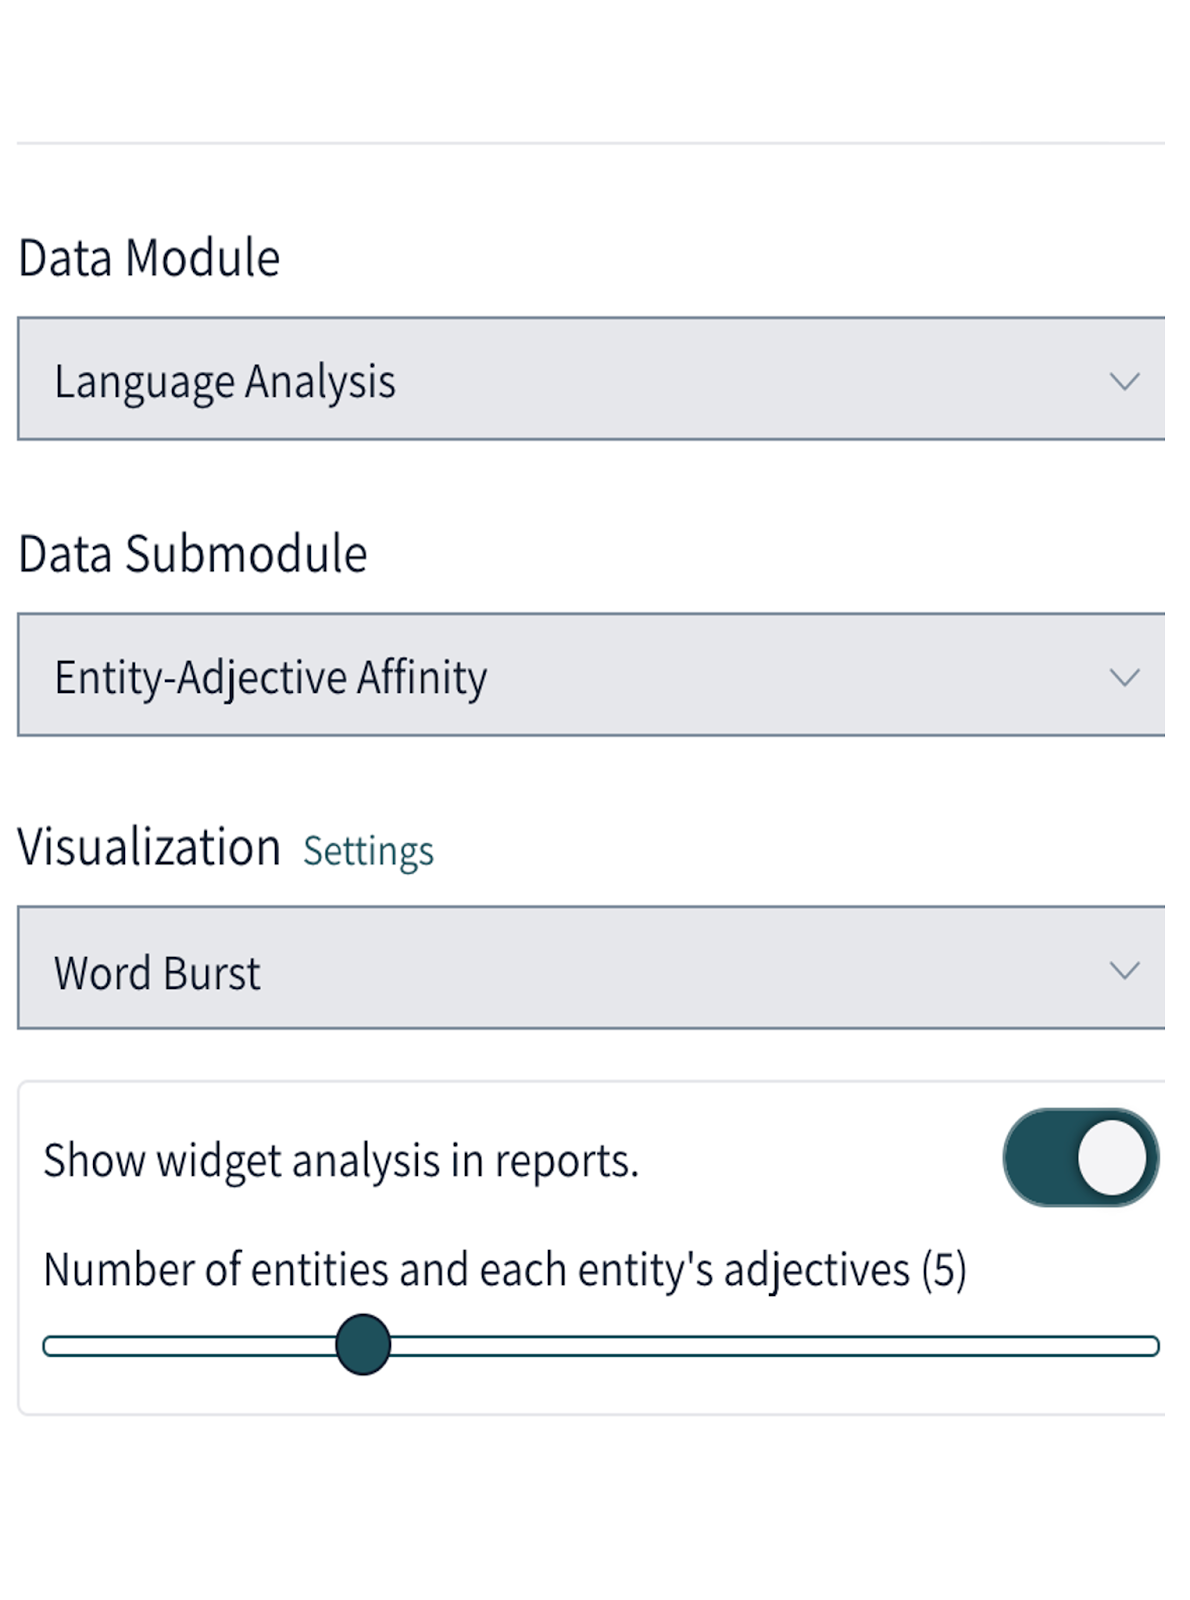
Also, you can now configure settings for your visualizations, like the ability to hide or show a widget from your reports.
For example, if you choose Language Analysis module > Entity-Adjective affinity > Word burst, you now will be able to set the number of entities you'd like to see in your report if this option is toggled on in your visualizations settings.
Using MEDIA segments
Segments allow you to filter the data within the monitor or the dashboard. All you need to do is create a segment and add your rules based on keywords or social media actions (retweet, hashtag, verified account, etc.).
There are three ways to create a segment:
-
From the main page, by clicking on Listen and then on Segments (Add new)
-
From a monitor by clicking on Segments and then Add New Segment
-
From a Dashboard by clicking on Segments and then Add New Segment
-
To know more about segments and possible rules, visit our helpdesk

DASHBOARDS
Get the most out of your geo-referenced maps!
A better and simpler experience to navigate your maps.
Now, you will only have to click over the title of each layer to toggle it ON or OFF.

Go: Analysis > Select Dashboard > Interact with maps
Add more context to your maps. With Image Overlay, you will now be able to add images as layers to your maps, such as building floor plans, infrastructure schematics, or any kind of image.

Go to AKTEK iO: Analysis > Select Dashboard > Edit > Edit map > Image Overlay > Position Image > Save
A new way to analyze and visualize your data!
A bubble chart allows you to create a new multidimensional visualization for quantitative values in your reports. This type of chart will allow you to display up to three data dimensions.
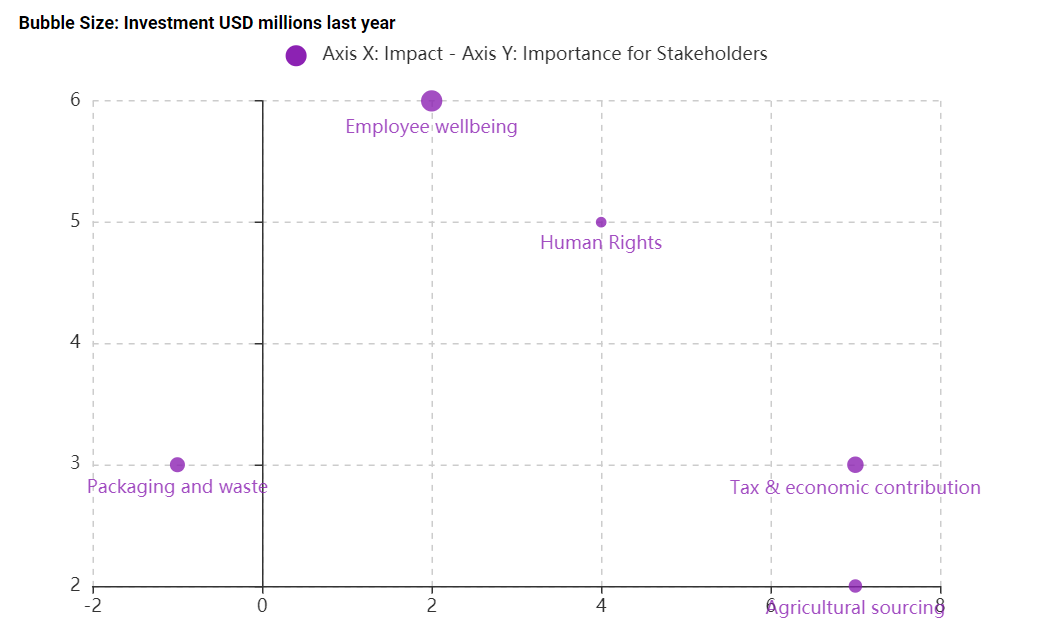
Go to AKTEK iO: Analysis > Create or Edit Dashboard > Drag and drop Bubble Chart.
One numerical value will work as your X-axis, the other for your Y-axis, and the other to define bubble size (Z). Bubble charts can facilitate the understanding of relationships between multiple variables. Learn more about them on our Helpdesk page.
A new way to visualize your data in GEO!
You can easily see changes over time for geotagged reports with a Date or Date/time field.
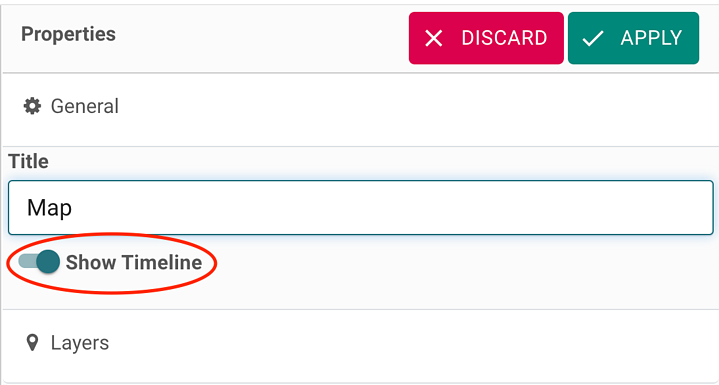
Add a timeline to your analytical maps and easily follow changes over space and time. Once you activate this option, you will see your interactive timeline in your map, as shown below:

Go to AKTEK iO: Analysis > select or create a map > click on edit > click on general > activate show timeline
Note: click on the play button to animate changes across time.
Easier dashboard creation!
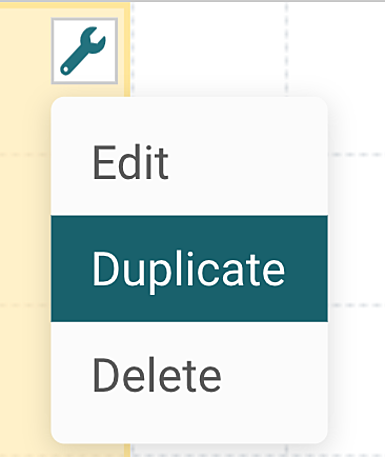
You can now duplicate any dashboard component (text, image, URL frame, line chart, bar chart, pie chart, influence matrix, and map) and use it to speed up the creation of different visualizations to serve your needs.
Don't leave anyone or anything behind!
With the AKTEK iO Business Process tool, you can configure steps and triggers on your custom reports. Make sure your data is up-to-date and that your team is on top of critical internal processes. Learn more about how to set it up here!
.png?) Go to AKTEK iO: Admin > Data > Business Process (BP)
Go to AKTEK iO: Admin > Data > Business Process (BP)
GENERAL TIPS & TRICKS
Another way to explore your reports!
With Explorer's new Hierarchy view, you will be able to explore your entire AKTEK iO system in a whole new way. To do it, you can easily switch from the traditional folder view by rapidly clicking this button on the right:


Go to AKTEK iO: Explore > Hierarchy button.
Small changes, big impact!
We enhanced the buttons, dropdown options, and how you interact with AKTEK iO for better ease of use.

Get the most out of our Helpdesk!
Remember, you can always go to our Helpdesk page and explore real-life examples and animated walkthroughs on how to use each feature in AKTEK iO.
If you have further doubts, feedback, or potential improvement suggestions for AKTEK iO, you can also send them through our Helpdesk feedback page.
Go to AKTEK iO: top right options > Help.
Scalability with colors!
Add Color Fields to key information reports to make sure you can create color categories in your visualizations based on pre-defined colors for your records.
Create bar charts, influence matrices, line charts, and Network visualizations color-coded based on your Color Fields.
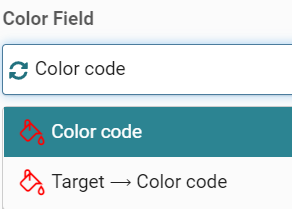
Go to AKTEK iO: Admin > Data Structure > Edit or Create > Add Color Fields
Easily apply dynamic coloring to your data!
With our new Conditional Coloring functionality, you will be able to apply specific colors to data that meet certain criteria. It is often used to highlight, emphasize, or differentiate subsets of information stored in your reports.

Go to: AKTEK iO > Click on Admin > Data > Conditional Coloring
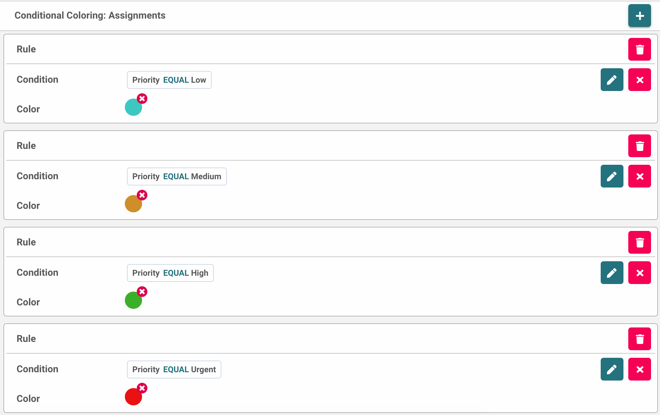
Once on the conditional coloring tab, select the report you wish to color your data from and create rules with conditions to determine how your data will be colored.
.png)